
Access all our platforms from a single account.

Rates volatility cracks, the yield holds - Options Brief - 7 October 2026

Summary: Rate volatility just took its second-biggest one-session fall on our board, and the yield it insures against did not move. Everything else was already sitting at the floor. So what is left to reprice?
Rate volatility took its second-largest one-session fall in our records. The yield it insures against barely moved.
MARKET REGIME: LOW VOL BULL | VIX 15.01 | TERM STRUCTURE: CONTANGO | SKEW: ELEVATED (141.21) | FRONT-MONTH VIX FUTURES: 17.24
Key findings
- Rate volatility broke, the level did not. MOVE fell 7.39% to 105.21 while the ten-year held near 5.31% and the thirty-year near 5.68%.
- The price of volatility moving is at the floor. VVIX at 82.59 is lower than all 60 of our stored sessions, where the median is 90.43.
- Two measures still sit near the top of their own three months: MOVE, with 5 of 60 sessions higher, and correlation at 11.49, with 11 of 60 higher.
Wall Street closed at a fourth consecutive record and the leadership came from an unusual place. Utilities gained 2.98%, the best of the eleven sectors, after Alphabet signed a twenty-year nuclear supply agreement with Constellation Energy, which rose 12.2%. Broadcom added 3.67% and Advanced Micro Devices 2.80%, while Nvidia managed 0.14% as it approached a six trillion dollar market value.
The macro ran the other way. The August trade deficit widened 13.7% on the month to USD 105.6 billion, the widest since early 2025, with imports at a record USD 420.8 billion. Treasury Secretary Scott Bessent argued the debt burden stays manageable, a view strategists met with scepticism.
Neither story moved the long end. The day’s real event sits in the option market rather than the cash market.
- US (Tuesday 6 October close): The S&P 500 rose 0.58% to a record 7,818.93, a fourth straight gain, the Nasdaq 100 0.48% to 31,224.69 and the Dow 0.49% to 51,526.14. The Russell 2000 fell 0.59% to 2,830.30. Breadth at the top was even, the equal-weight index up 0.58%, while the biotech fund fell 3.39% and the memory index 3.49%.
- Europe: A third consecutive advance. The Stoxx Europe 600 gained 0.48% to 636.64, led by banks, the DAX 0.77% to 25,449.19 and the FTSE 100 0.4% to 10,541.69. French government bonds rallied on Marine Le Pen’s deficit plan.
- Asia (Wednesday morning): The Nikkei 225 is 0.73% lower at 70,166.50 and the Hang Seng 0.53% lower at 24,151.90. Korea is weakest, the Kospi 0.90% lower near 6,879, memory heavyweights the drag. Mainland China stays shut for Golden Week.
- Commodities and rates: Brent trades near 101.5, Tuesday’s slump to 97 reversed on attacks against vessels crossing the Strait of Hormuz, with West Texas Intermediate more than 10 dollars below it. Gold eased to 4,130. The thirty-year yield is 5.68%, the ten-year 5.31%, the two-year 4.81%.
- Market regime: Low volatility bull: VIX 15.01, the cash curve in contango, twenty-day realised volatility 10.13% and stable, the index 1.90% above its fifty-day average.
Source: Saxo, Bloomberg, CBOE. Levels as of the 6 October close unless stated. Yield levels come from the published close, not the export’s change column, which did not reconcile. Past performance is not indicative of future results.
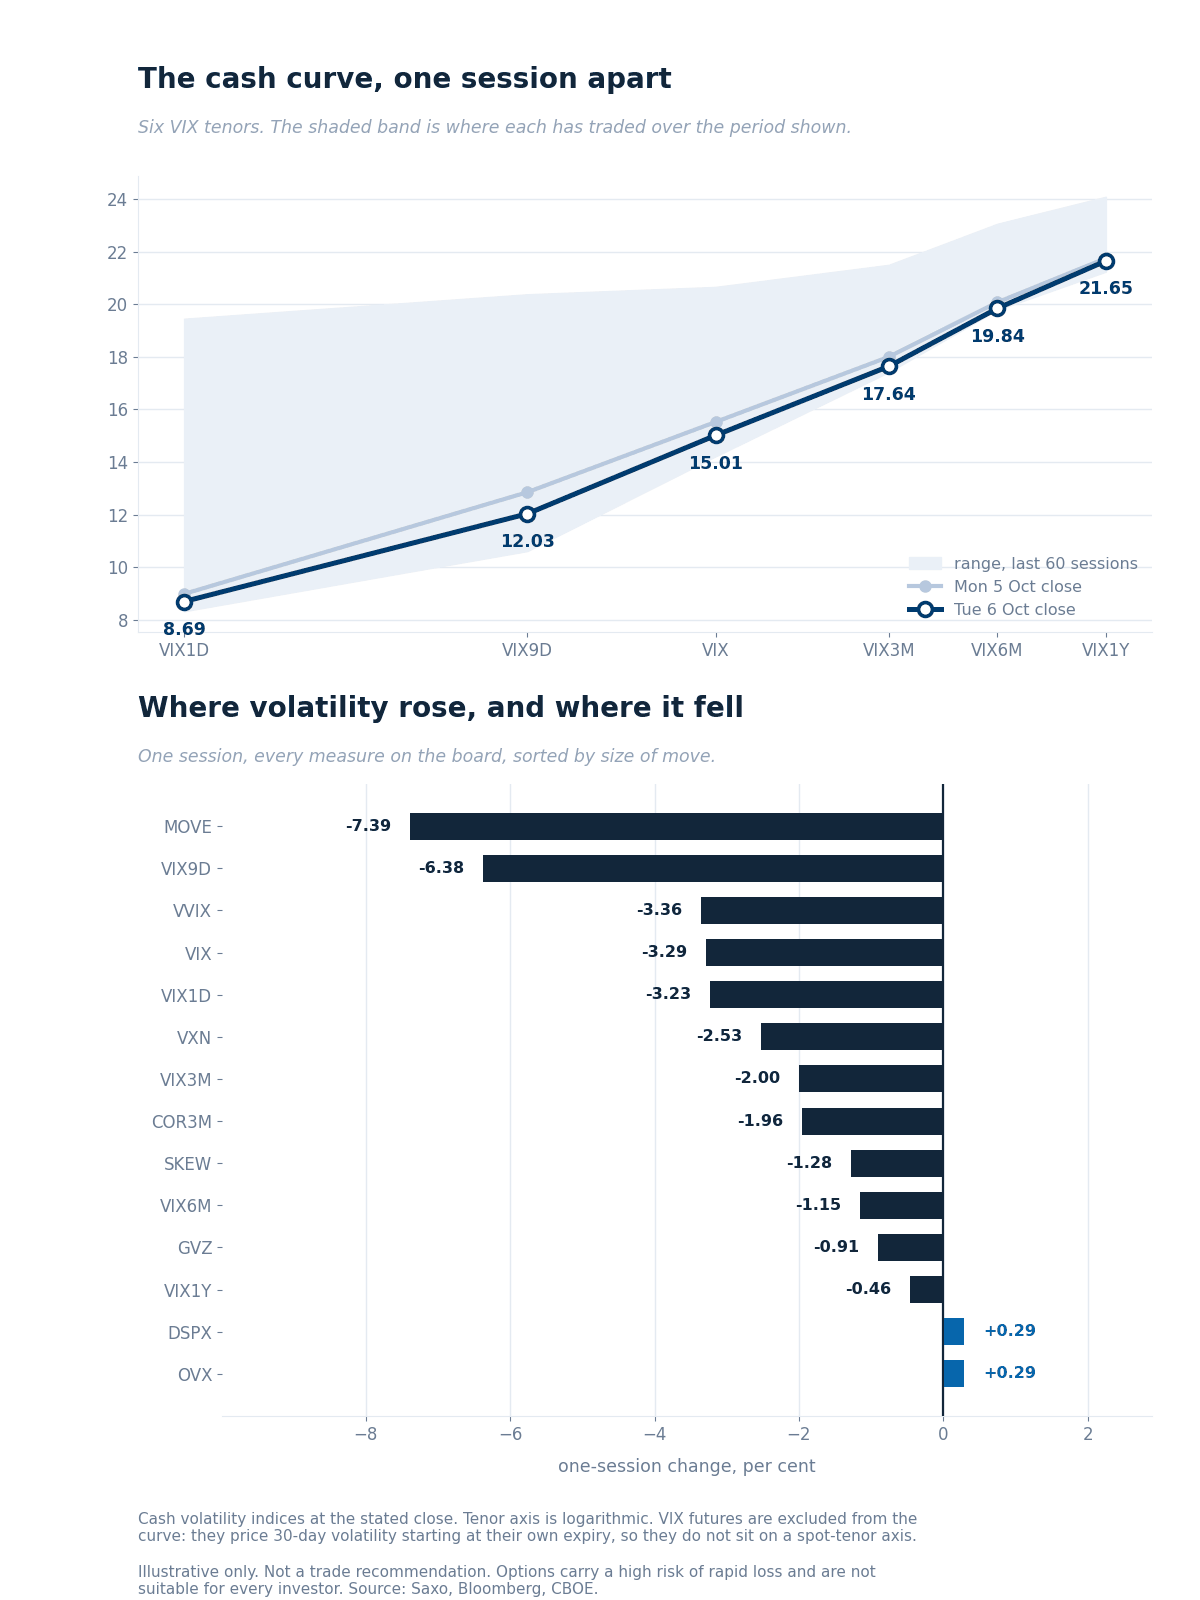 The six cash VIX tenors at Tuesday’s close against the prior session, over their 60-session ranges.
Reading the curve
- Every tenor came in together, which yesterday’s curve did not do, and three readings now sit at or near the floor of the window. VVIX at 82.59 is lower than all 60 stored sessions, VIX1D at 8.69 lower than 58 and gold volatility at 22.97 lower than 57.
- Rates and correlation hold the only extremes left, and one just moved. MOVE at 105.21 stays higher than all but five stored sessions against a median of 76.13, after the window’s second-largest one-session fall. Correlation at 11.49 is higher than all but eleven.
- Ratios the graphic omits. VIX3M to VIX is 1.175 against a median of 1.176, so the curve’s shape is ordinary while its level is low. SKEW eased to 141.21, high against a long-run norm nearer 115, below its three-month median of 144.69.
VIX futures
- Parity puts the October forward at 17.09 and the November at 17.64, each within 0.16 of its feed, so neither has rolled.
- The premium to spot widened to 2.08 points from 1.92: both legs fell, spot by 0.51 and the forward by about 0.35, so the front gave way faster.
Source: Saxo, Bloomberg, CBOE, 7 October 2026, approx. 06:00 CET. Past performance is not indicative of future results.
Saxo’s implied-volatility rank across 186 US and 335 euro-zone option underlyings, where 0 is a one-year low and 100 a high. Both universes are unchanged from yesterday, so medians compare directly today.
- The typical US name did not move. Median rank is 43.9 against 43.7, on median implied volatility of 32.8 either way, while Europe eased to 45.5 from 48.2. Rank concentrates at the bottom: 35 of 186 US names sit at 20 or lower, against nine at 80 or higher.
- Rates and credit own what is left of the top, and every one gave ground in a session. The long-bond fund ranks 81.2 after falling 16.2 points, the investment-grade credit fund 82.0 after 7.9 and the seven-to-ten year Treasury fund 67.1 after 8.5. Their median rank of 67.1 is second only to health care at 69.6.
- The rank and percentile distinction is doing visible work. That same fund carries a percentile of 98.0, so it has come well off the year’s high and still prices above almost every day of the year. Rank measures distance from the extremes; percentile counts the days.
- Health care supplies four of the nine US names at rank 80 or above, Danaher and Merck both at 94.6, refiners two more. Nvidia sits at the other end on 1.5. See Saxo pricing for costs and charges.
Data source: Saxo, as of 7 October 2026, reflecting the 6 October close. Past performance is not indicative of future results.
Based on end-of-day 6 October, Tuesday’s positioning and not today’s price action.
Ten reports, one verdict: no readable direction. Conviction came back low in every category, size sat in mid-market crosses and paired packages, and the few clean aggressor sides cancelled out.
- Single-name flow leaned to sold premium rather than to a direction, with bought protection close to absent.
- Sector and ETF flow was the one place a side resolved, and it resolved protective: rates and credit funds ran almost entirely to puts. Named funds are market context only; see Saxo pricing for costs and charges on exchange-traded fund trades.
What the option market priced for this week, drawn around Friday’s close.
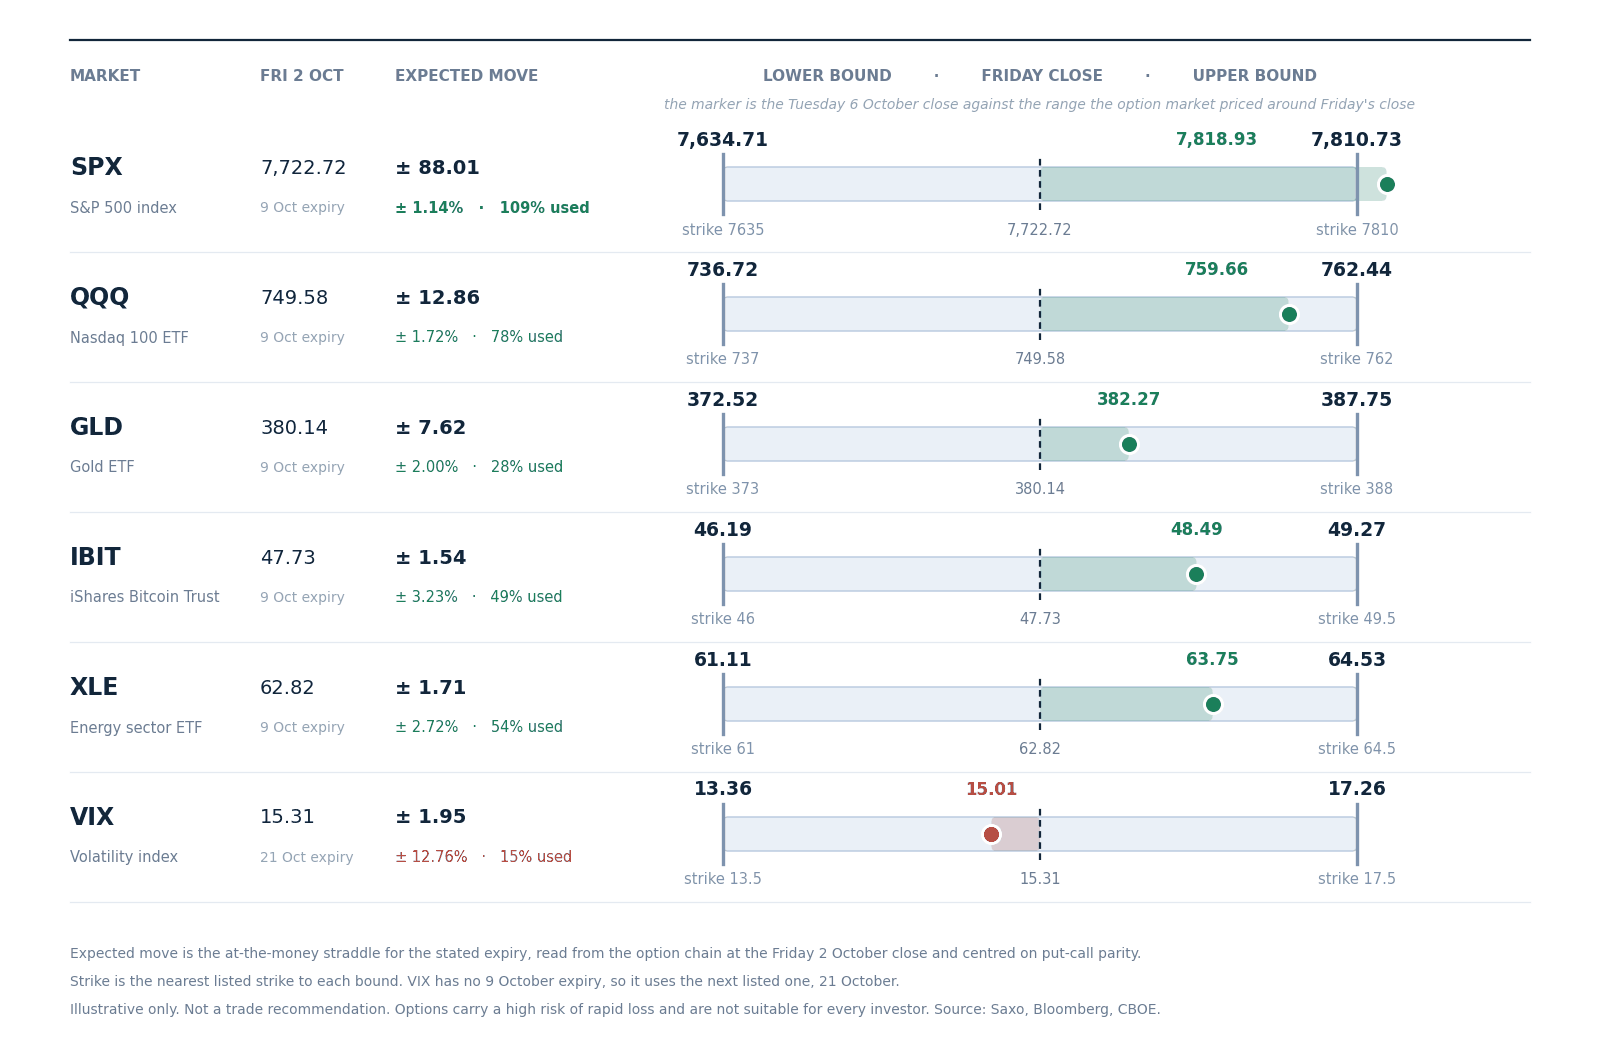 Expected move to Friday 9 October, drawn around the 2 October close with the nearest listed strike at each bound, derived from option-implied pricing. Volatility uses the 21 October expiry, which is the next listed one. Read from the chain at Friday’s close, not a forecast.
- The index has spent the week’s range with two sessions still to run. The S&P 500 closed Tuesday at 7,818.93, above the band top of 7,810.73 drawn around Friday’s 7,722.72, which is 109% of the move priced for the whole week.
- Nothing else is close. The Nasdaq 100 fund has used 78% of its band, energy 54%, the bitcoin fund 49% and gold 28%, while volatility sits 15% below its anchor. A fully used band is not a forecast that the index stops; it says the option market priced a quieter week than the one that arrived.
- Options carry a high risk of rapid loss and are not suitable for every investor; see Saxo pricing for costs and charges.
The US cash session runs 15:30 CET to 22:00 CET. German August industrial production landed at 08:00 CET, the weekly EIA crude and fuel stocks report arrives at 16:30 CET, the Federal Reserve’s meeting minutes at 20:00 CET and August consumer credit at 21:00 CET.
The minutes are the one that matters for pricing. They land two hours before the 22:00 CET cash close, so today’s expiry settles after them and contains both the release and the first reaction, rather than sitting in front of it.
Earnings stay light until Thursday, when PepsiCo, Fast Retailing, Progressive and Tesco report, followed by Delta Air Lines on Friday. Future outcomes are uncertain and may result in losses.
- Session implied move. SPXW options price 30.15 points, or 0.39%, to tonight’s close and 58.35, or 0.75%, to Friday’s, derived from option-implied pricing. Quotes before the open are indicative.
- What the clock explained. Friday’s expiry priced 69.85 points yesterday and 58.35 now, where decay alone leaves about 60.5. Only 2 points came out beyond the clock, against roughly nine a session earlier.
- Tail risk signal. SKEW eased to 141.21 and VVIX to a 60-session low while the front-month premium to spot widened to 2.08 points. In our view the market may be paying less for the tail while still charging for the forward.
- Correlation read. Implied correlation at 11.49 is higher than 49 of 60 sessions while dispersion at 35.09 sits mid-range. In our assessment what is left of index volatility may be held up by correlation rather than by the names.
The question is whether the one remaining extreme follows the rest down. Rate volatility came off the top of its range in a single session without the yield that drives it moving at all.
In our view that may mean the repricing has further to run, or that the market has stopped paying for a risk it still faces, with the Federal Reserve minutes due inside today’s session. Options carry a high risk of rapid loss.
Important note: The strategies and examples provided in this article are purely for educational purposes. They are intended to assist in shaping your thought process and should not be replicated or implemented without careful consideration. Every investor or trader must conduct their own due diligence and take into account their unique financial situation, risk tolerance, and investment objectives before making any decisions. Remember, investing in the stock market carries risk, and it’s crucial to make informed decisions.
| More from the author |
|---|