
You can access both of our platforms from a single Saxo account.

Cancellation, not calm - Options Brief - 21 October 2026

Summary: The index closed up a quarter of a per cent and the price of index volatility fell 6%. Underneath it biotech rose 3.64% and the biggest technology names fell. The quiet was arithmetic.
The index stood still because its parts pulled against each other.
MARKET REGIME: TRANSITIONING | VIX 17.31 | TERM STRUCTURE: CONTANGO | SKEW: ELEVATED (160.40) | FRONT-MONTH VIX FUTURES: 18.350
Today in brief
The short version. Index volatility fell across the curve and hardest at the front, three-month implied correlation dropped 5.86% to 12.86, and the typical single name’s implied volatility did not move at all. The index was quiet by cancellation rather than by calm.
Markets. The S&P 500 rose 0.28% to 7,712.57 and the Nasdaq 100 fell 0.13%, while the equal-weighted S&P gained 1.15%, the small-cap fund 1.66% and biotech 3.64%. Meta fell 1.59% and Alphabet 1.13%. Equifax rose 11.3% and Eli Lilly 3.5% on results, General Motors fell 6.8%, and after the close SpaceX added around 9% and Tesla about 2% on merger talk. Europe was mixed and mostly lower, with the German to French ten-year spread at its widest of this cycle. This morning the Kospi is up 2.79% and Brent is at 110.44.
Volatility curve. VIX1D fell to 11.20 and the nine-day measure to 16.27, against the thirty-day at 17.31. The one-year gave up only 0.25 to 22.05 and sits near the top of its sixty-session range. The October VIX future settles at this morning’s open, so November at 18.650 becomes the reference contract.
Single names. Median implied-volatility rank on an identical 187 US names rose to 46.1 from 45.2, with median implied volatility unchanged at 33.6%. Rank rose most in health care, up 3.9 points, and energy, up 2.9, which is where the rotation went.
Looking back: TLT. The 20 November 76 put sold on 29 September has earned 80% of its premium with 21 of 52 days gone. What is left pays about 3.0% a year against 4.11% on a one-month Treasury bill. In our view the last part of a premium can be the worst paid.
Flow. Nine of the ten reports read as rolls, paired legs and mid-market prints with no readable direction. Nothing in the set pairs an index position against single names, so the flow does not corroborate the correlation story.
This week’s range. Two sessions in, the S&P 500 has used 45% of the 1.56% priced for the week, against 40% of the week. The volatility index has gone through the bottom of its band, and that row’s expiry settles this morning.
Earnings and catalysts. Meta and Tesla report after the 22:00 CET close, both priced under their own history at 0.9x and 0.8x the eight-report average. UK inflation at 08:00 CET, the weekly petroleum report at 16:30 CET and a twenty-year note auction at 19:00 CET fill the session.
What it adds up to. Today’s expiry prices 0.534% and Friday’s 0.957%, against 1.21% quoted for that same Friday a session ago, while SKEW held at 160.40. In our view the option market took premium out of correlation rather than out of the parts, and two of the index’s largest names report tonight.
That is the whole brief in one read. The sections below hold the detail behind each paragraph, with the charts, the full set of readings and the sources, for when you want to go deeper on one part.
Headline driver
The S&P 500 closed up 0.28% at 7,712.57 and the Nasdaq 100 fell 0.13%, which reads as a quiet session until you look inside it. The equal-weighted S&P rose 1.15%, the Russell 2000 fund 1.66%, biotech 3.64%, healthcare 2.37% and regional banks 1.96%. The large technology names went the other way, Meta losing 1.59%, Alphabet 1.13% and Apple 1.00%. The two moves were close to the same size and pointed in opposite directions, so the index recorded almost nothing. Equifax rose 11.3% and Eli Lilly 3.5% on results, while General Motors fell 6.8% on its cost outlook. After the close SpaceX added around 9% on a 4.4 billion dollar quarterly profit and Tesla about 2%, after Elon Musk called a merger of the two a good idea.
Market snapshot
- US (Tuesday 20 October close): S&P 500 7,712.57, up 0.28%. Nasdaq 100 29,490.28, down 0.13%. Dow Jones Industrial Average 52,501.24, up 1.02%. The equal-weighted S&P 500 rose 1.15% and the Russell 2000 fund 1.66%. Biotech led at 3.64%, pharmaceuticals 3.07% and healthcare 2.37%, while technology fell 0.28% and semiconductors 0.38%.
- Europe: the Stoxx 600 eased 0.14% and the Euro Stoxx 50 0.38%, with the DAX little changed at 25,304.42 and the CAC 40 down 0.38%. Switzerland’s SMI rose 0.76% on a cancer-drug partnership. The German to French ten-year spread closed at its widest of this cycle, 153 basis points.
- Asia (Wednesday morning): the Kospi rose 2.79% to 5,707.57, recovering Tuesday’s fall in Korean technology shares. Hong Kong’s Hang Seng eased 0.35% and the CSI 300 0.65%.
- Commodities and rates: Brent traded at 110.44 and WTI at 99.22 at the 06:00 CET pull, both up around 1.5%. Gold held near 4,136 and silver eased 0.87%. The US ten-year yield was 5.123%, the thirty-year 5.434% and the two-year 4.79%. Bitcoin slipped 0.51% to 82,560.
- Market regime: transitioning, with the VIX at 17.31, the cash curve in contango and SKEW elevated at 160.40.
All figures from the watchlist export taken at 06:00 CET on 21 October 2026. Source: Saxo, Bloomberg, CBOE.
Volatility surface
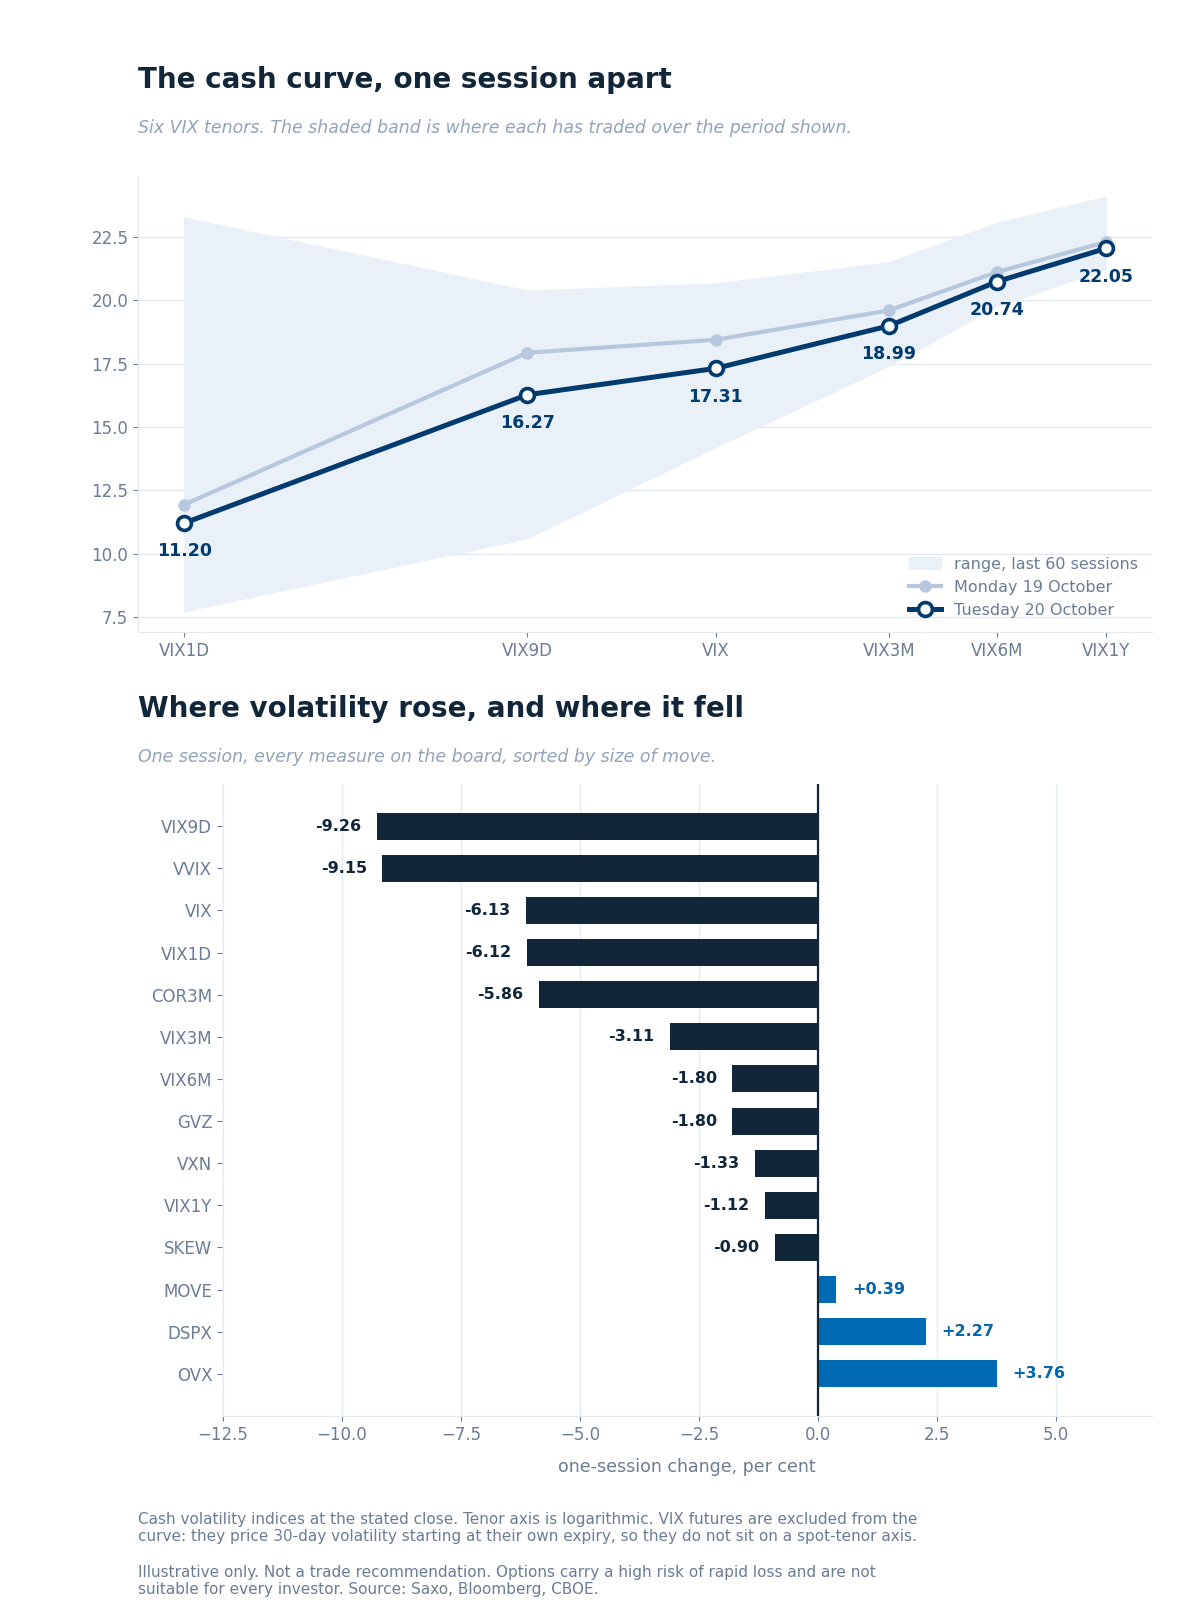
The cash curve against the previous session, over each tenor’s 60-session range, with the one-session change across every measure on the board. Source: Saxo, Bloomberg, CBOE.
The whole cash curve came down and the front came down hardest. VIX1D fell 0.73 of a point to 11.20 and the nine-day measure 1.66 to 16.27, against 1.13 off the thirty-day at 17.31. The one-year gave up 0.25 to 22.05 and stays near the top of its sixty-session range. The fall was concentrated where the index was being hedged rather than spread across the term.
Ratios. VIX1D/VIX reads 0.65, unchanged from a session ago. VIX3M/VIX rose to 1.10 from 1.06 as the front fell away from the back. VXN/VIX is 1.46 against 1.39, with the Nasdaq gauge at 25.22, giving back less than the broad measure.
VIX futures. The October contract reads 18.350 and November 18.650, a front-month ratio of 0.985. October settles against this morning’s opening quotation, so its premium to spot is not comparable with a session ago and no change is drawn from it. November becomes the reference contract today, over a window carrying the 28 October Federal Reserve decision and the 3 November midterms.
Rates and correlation. The bond gauge rose 0.39% to 101.71 and oil volatility 3.76% to 52.11, now 3.01 times the equity gauge against 2.72 a session ago. Gold volatility eased 1.80% to 21.83. Three-month implied correlation fell 5.86% to 12.86 while dispersion rose 2.27% to 37.33, the two moving apart rather than together.
Single-name volatility
Median implied-volatility rank, identical 187 US names: 46.1 from 45.2.
What the options market taught us: TLT
On 29 September we looked at selling a TLT put: the 20 November 76 put, an obligation to buy the bond ETF at 76. Long-dated yields have eased since and TLT has risen, with four weeks still to run.
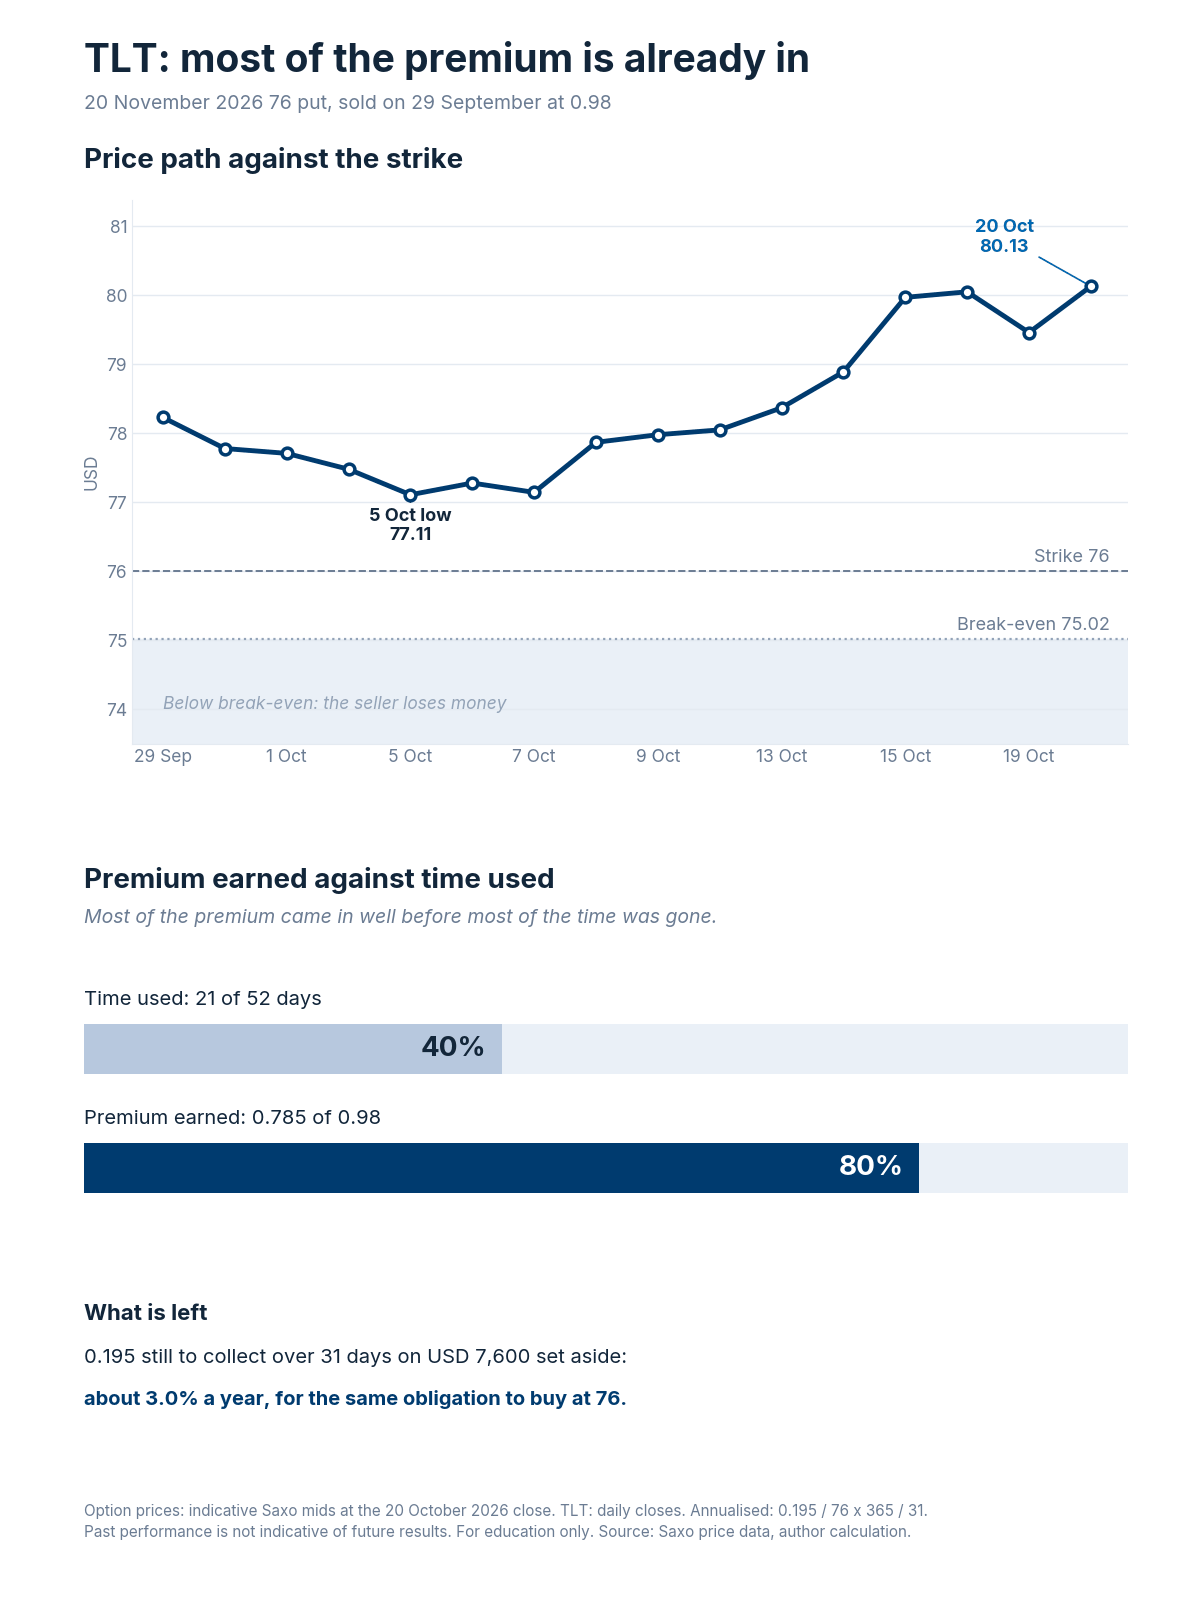
TLT closes against the 76 strike, and premium earned against time used. Past performance is not indicative of future results. Source: Saxo price data, author calculation.
- Collected: 0.98 on 29 September.
- Worth now: 0.195 (indicative mid, 20 October close): 80% earned, 21 of 52 days gone.
- Left to earn: 0.195 over 31 days on USD 7,600, about 3.0% a year (0.195 / 76 x 365 / 31), below the 4.11% on a one-month Treasury bill (Federal Reserve, 19 October).
In our view, the last part of a premium can be the worst paid. The chance of assignment has fallen, but the cash tied up and the loss below 75.02 have not. Holding keeps both in place to earn that 0.195; closing frees the cash and forgoes it; rolling later collects new premium for a longer commitment; assignment means owning TLT at an effective 75.02. Hypothetical, for education only.
Options carry a high risk of rapid loss and are not suitable for every investor. Costs and charges apply and vary by account and venue. Past performance is not indicative of future results. Source: Saxo price data, author calculation.
Options flow sentiment
Based on end-of-day 20 October, yesterday’s positioning, not today’s price action.
- Single-name flow gave no readable direction. Nine of the ten reports are rolls, paired legs and mid-market prints, several carrying a conviction label of two out of five. The one clean strand sits in energy, where protection was bought on the ask and upside was supplied.
- Sector and ETF flow does not corroborate the index story. Nothing in the set pairs an index position against single names, which is the shape a correlation trade takes, and the only explicit index-level prints were upside calls bought on the ask.
Where the week's range sits
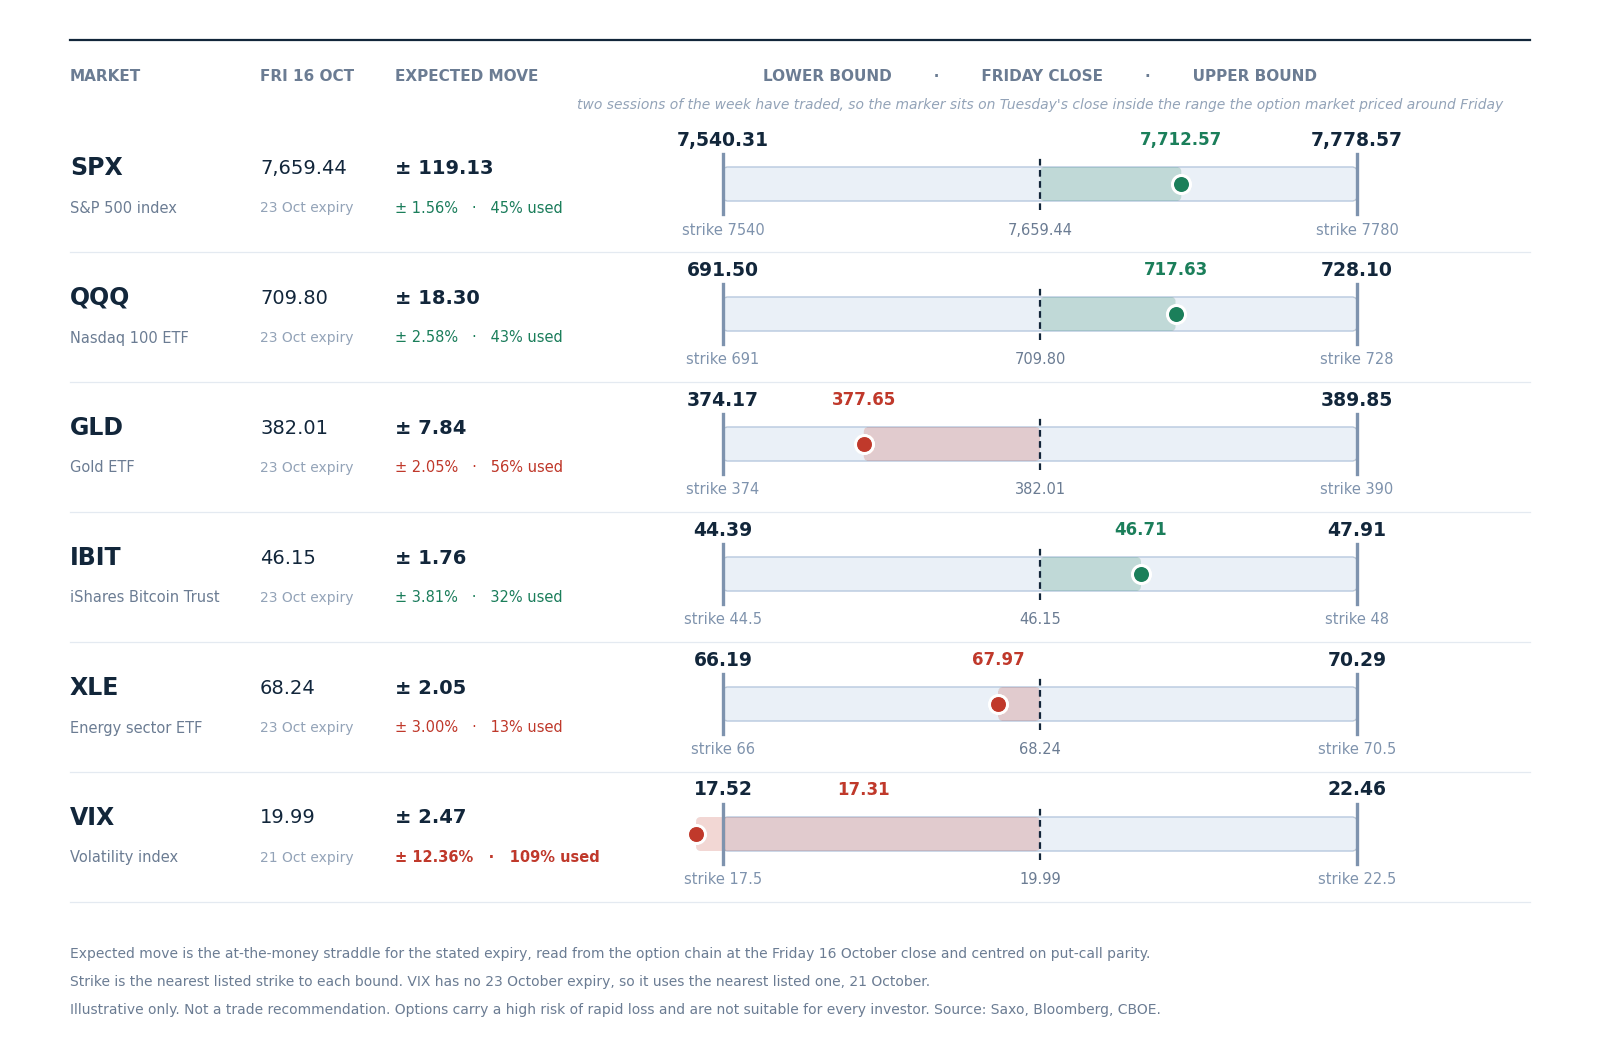
The range the option market priced for this week around Friday 16 October’s close, with the nearest listed strike at each bound. Two sessions have traded, so the marker sits on Tuesday’s close. Straddles come from the Saxo chain at Friday’s close, centred on put-call parity. Illustrative only, not a trade recommendation. Source: Saxo, Bloomberg, CBOE.
Two sessions in, the S&P 500 has used 45% of the 119.13 points, 1.56%, priced around Friday’s close, against 40% of the week.
Gold has used 56%, all of it downward, the only market past half its range. The Nasdaq 100 fund has used 43%, the bitcoin fund 32% and energy 13%.
The volatility index has gone through the bottom of its band, priced between 17.52 and 22.46 around Friday’s 19.99 close and now at 17.31. That row’s 21 October expiry settles at this morning’s open, so the band is finished.
Friday’s expiry stops before the 28 October Federal Reserve decision, so none of the band pays for it.
Options carry a high risk of rapid loss and are not suitable for every investor. Costs and charges apply and vary by account and venue; check the rates applicable to you before entering any position.
Today's catalysts
- UK September inflation and public sector borrowing at 08:00 CET, the European releases of note.
- The weekly US petroleum inventory report at 16:30 CET, inside the cash session. The industry body reported a 4.9 million barrel draw in US crude stocks the evening before, with Brent near 110 for a third day.
- A US twenty-year note auction at 19:00 CET, three hours before the 22:00 CET cash close, with the ten-year yield at 5.12%.
- The Federal Reserve is in blackout before the 28 October decision.
- Earnings today: Meta and Tesla after the cash close, with IBM, Texas Instruments, Lam Research, Thermo Fisher, Abbott, AT&T and SAP around it.
Earnings scorecard
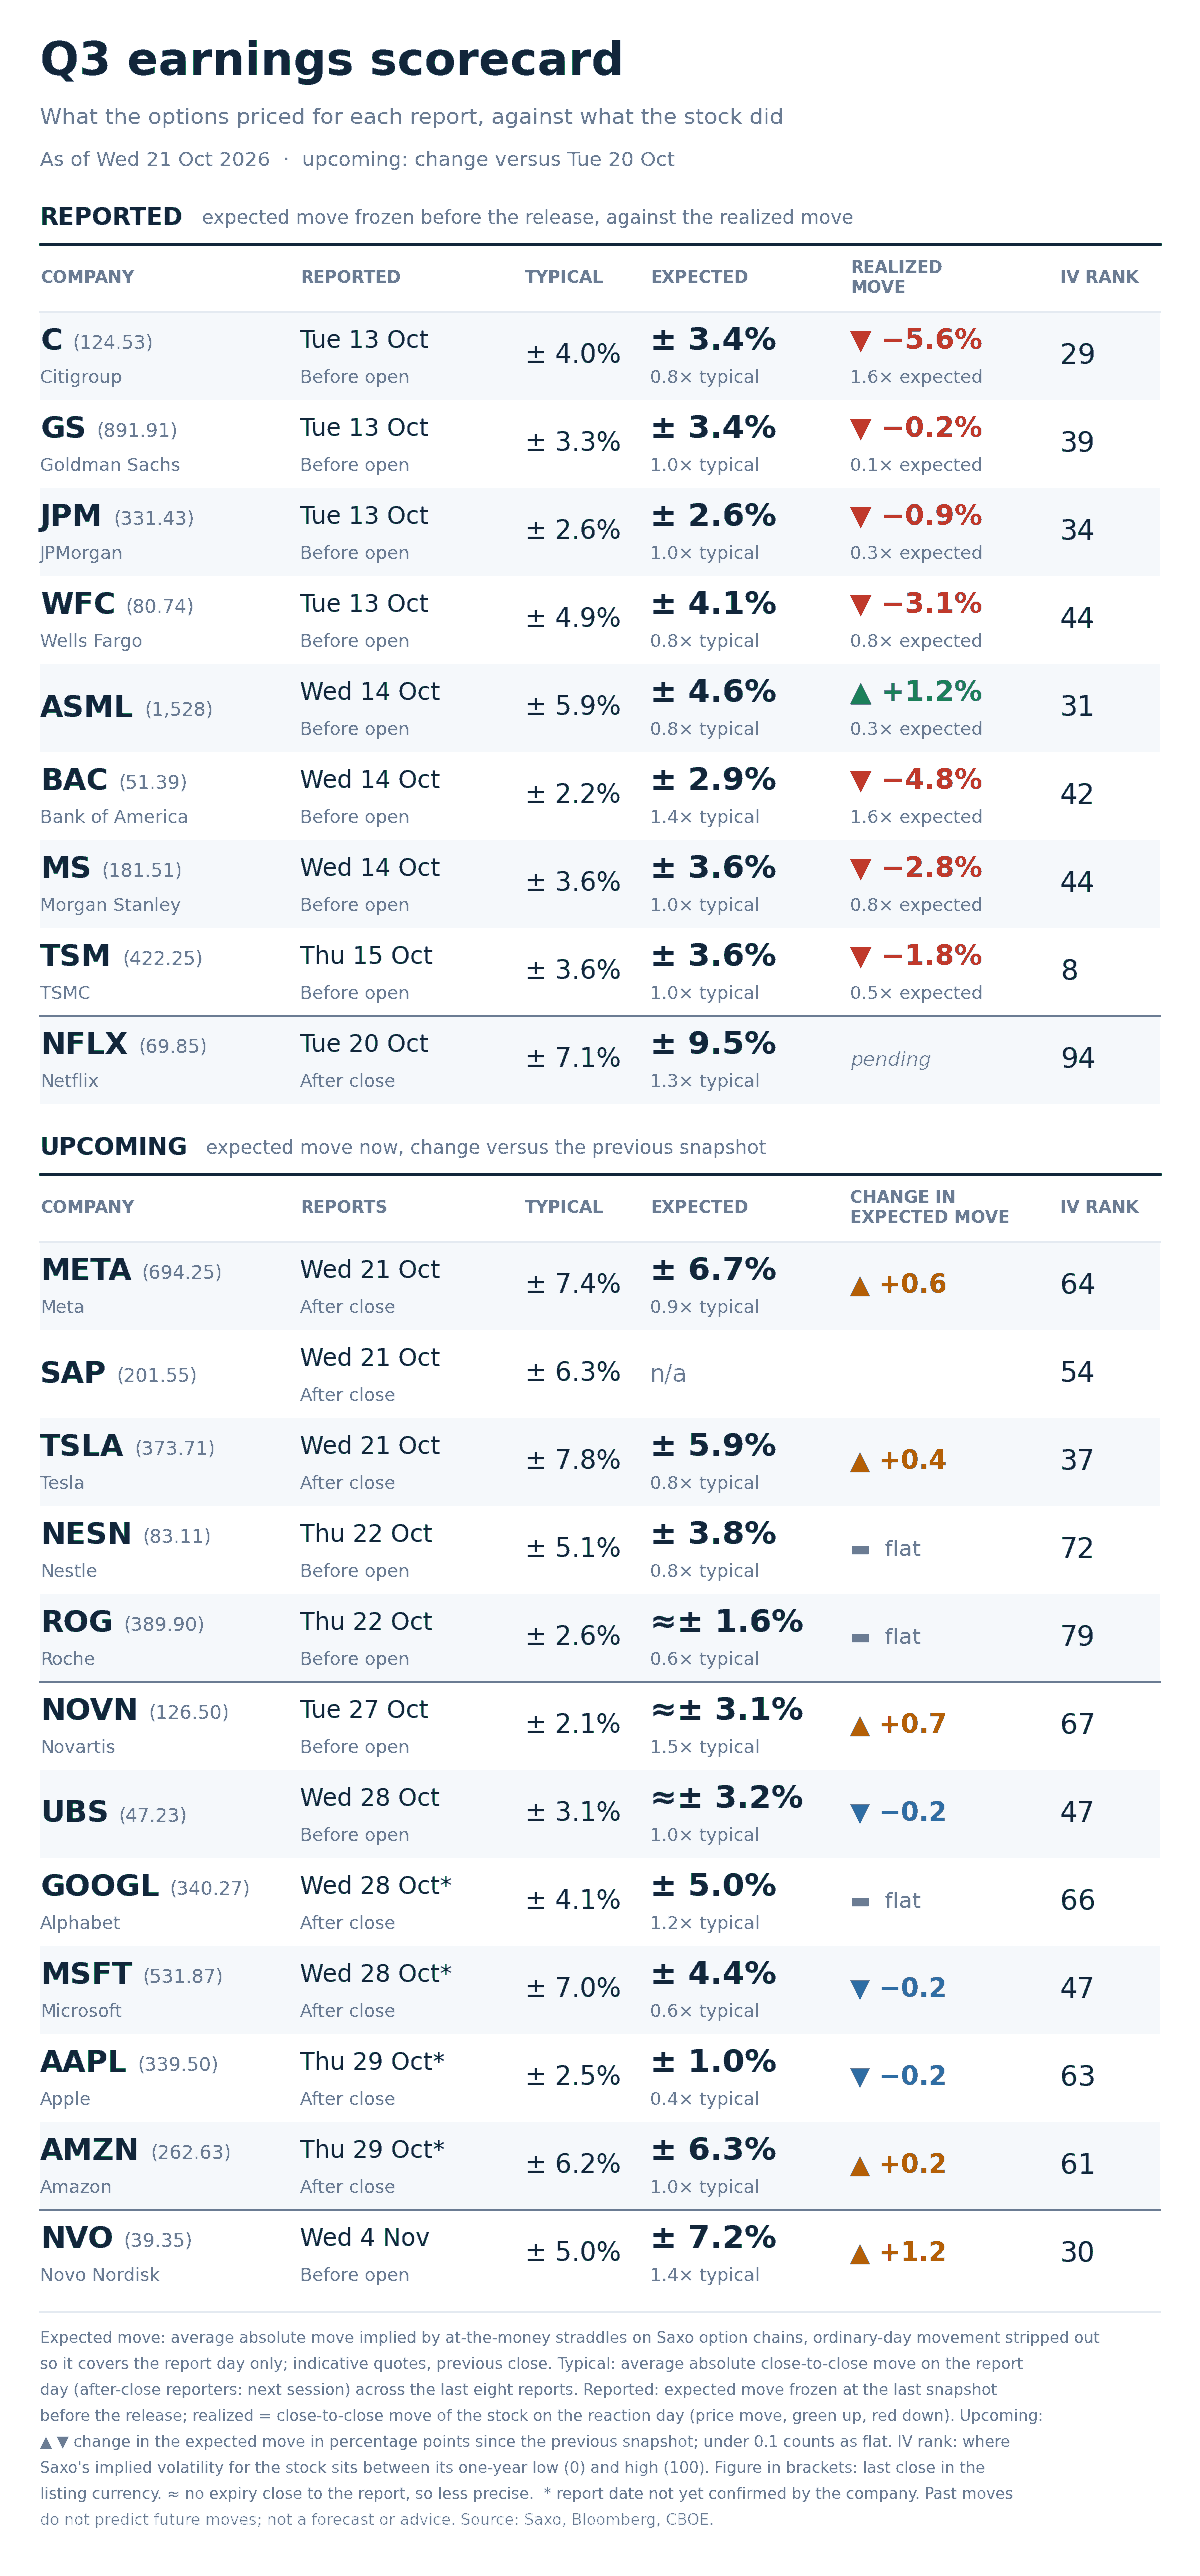
Option-implied expected move for each report day against the average move after the last eight reports, as of 21 October 2026. Illustrative only, not a trade recommendation. Source: Saxo, Bloomberg, CBOE.
- Tonight’s two are both priced below their own history. Meta prices 6.7% against a 7.4% eight-report average, 0.9x, and Tesla 5.9% against 7.8%, 0.8x. Meta’s last four reports moved 11.3%, 10.4%, 8.6% and 8.0%, so the premium is asking for a calmer release than the recent run.
- The widest premium on the board is not in technology. Novo Nordisk prices 7.2% against a 5.0% average, 1.4x, and Novartis 3.1% against 2.1%, 1.5x. Both are health care names, which is where single-name implied-volatility rank rose most yesterday.
- Rank and event premium answer different questions. Roche carries a rank of 79 and prices about 1.6%, the smallest expected move among the names still to report. A high rank says the name is dear against its own year; the expected move says what this particular report is worth.
- Next up: Meta, Tesla and SAP tonight, Nestle and Roche tomorrow.
Options carry a high risk of rapid loss and are not suitable for every investor. Costs and charges apply and vary by account and venue; check the rates applicable to you before entering any position.
What the market is pricing
- Session implied range: today’s expiry prices 41.15 points, 0.534%, against 42.1 and 0.55% yesterday.
- Event implied range: Friday’s expiry prices 73.80 points, 0.957%, against 92.9 and 1.21% a session ago, four sessions to run then, three now. Decay alone leaves about 80.5, so roughly 7 points came out beyond the clock.
- Correlation read: three-month implied correlation fell 5.86% to 12.86 while the typical US single name’s implied volatility was unchanged at 33.6%, so the index gauge’s 6.13% fall sits in correlation rather than in the parts. Median rank rose most in health care, up 3.9 points, and energy 2.9: single-name volatility rose where the rotation went, while index volatility fell.
- Tail risk signal: SKEW eased 0.90% to 160.40 and the tail-risk gauge 14.77% to 17.32. Far downside is cheaper than a session ago, still dear against anything before last week.
In our view the index’s quiet is arithmetic, not a settled market. Mega-cap technology and the rest moved the same distance in opposite directions, the index netted them off, and the option market repriced correlation, not the parts. Two of its largest names report tonight, and what cancelled yesterday need not cancel again.
Options carry a high risk of rapid loss and are not suitable for every investor. Costs and charges apply and vary by account and venue; check the rates applicable to you before entering any position. Past performance is not indicative of future results.
| More from the author |
|---|