
Un seul compte Saxo suffit pour accéder à nos plateformes.

Which options looked expensive against their own history, and which looked cheap
Options

Résumé: A nightly scan of 511 option underlyings ranked every implied volatility reading against its own past year. Twenty names sat at the extremes at Friday’s close, and the gap between the two ranking columns says more than the headline numbers do.
A high reading does not mean the share is volatile. It means its options cost more than they usually do.
Implied volatility alone says little about whether an option is dear. A biotech at 60 percent may be cheap by its own standards while a utility at 18 percent sits near the top of its range. IV rank places the current reading inside the highest and lowest levels the underlying has seen over the past year, on a zero to one hundred scale. IV percentile answers a different question: what share of that year’s sessions closed below the current level. Friday 25 September produced two readings at rank 100 with percentile 100. (Source: Saxo OpenAPI, close of 25 September 2026, recorded 26 September 2026. Past performance is not indicative of future results; figures are illustrative and not predictive.)
The scan covered 186 US and 325 euro-zone underlyings. Median rank was 37.0 in the US sample and 37.7 in Europe, and about seven percent of each carried a rank above 70, so the names below are outliers in an unremarkable tape.
Reading the two columns together
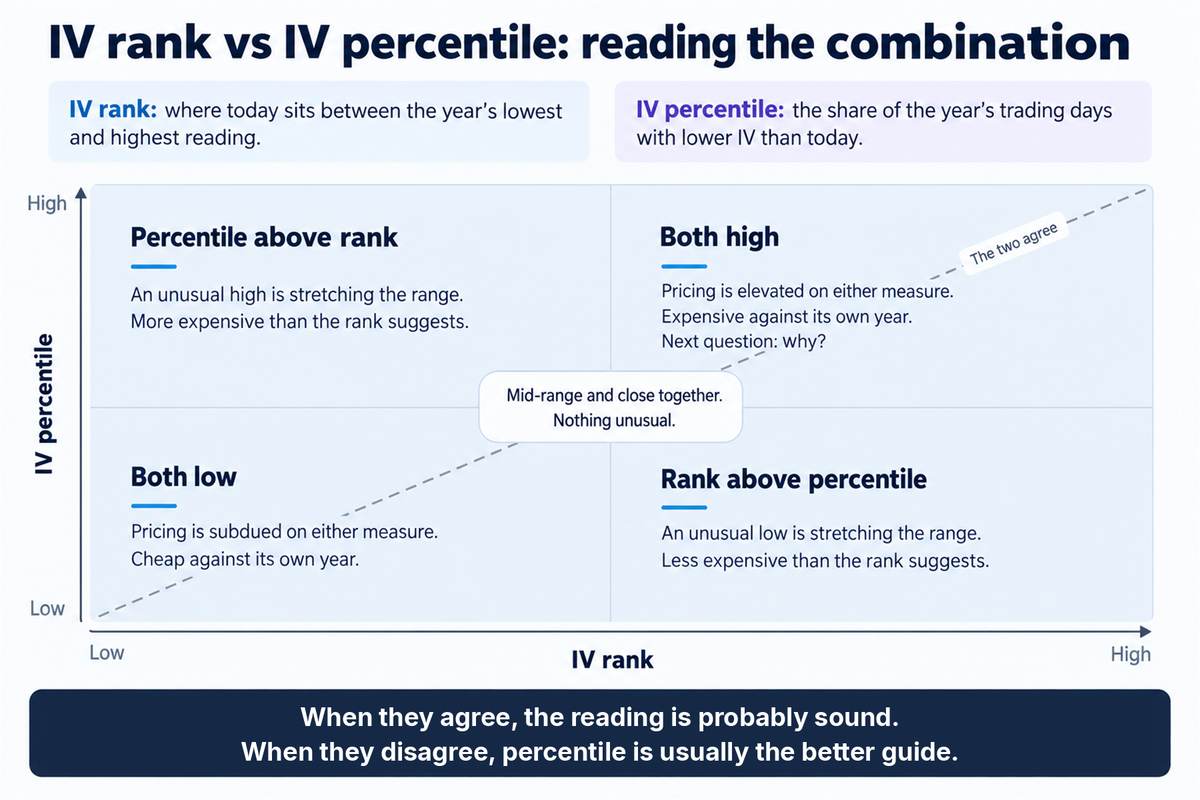
Rank and percentile usually agree. When they diverge, the shape of the past year is talking: a rank well above its percentile means one violent episode stretched the range, so the level looks high against the extremes while the distribution calls it ordinary. A rank below its percentile means the reverse.
Neither column is a signal. Dear optionality can become dearer, cheap optionality can stay cheap for months, and options carry a high risk of rapid loss and are not suitable for every investor. Every reading below comes from the same 25 September snapshot. Tickers are Saxo instrument symbols, resolved through reference data rather than the option root, which often differs.
Important note: The strategies and examples provided in this article are purely for educational purposes. They are intended to assist in shaping your thought process and should not be replicated or implemented without careful consideration. Every investor or trader must conduct their own due diligence and take into account their unique financial situation, risk tolerance, and investment objectives before making any decisions. Remember, investing in the stock market carries risk, and it’s crucial to make informed decisions.
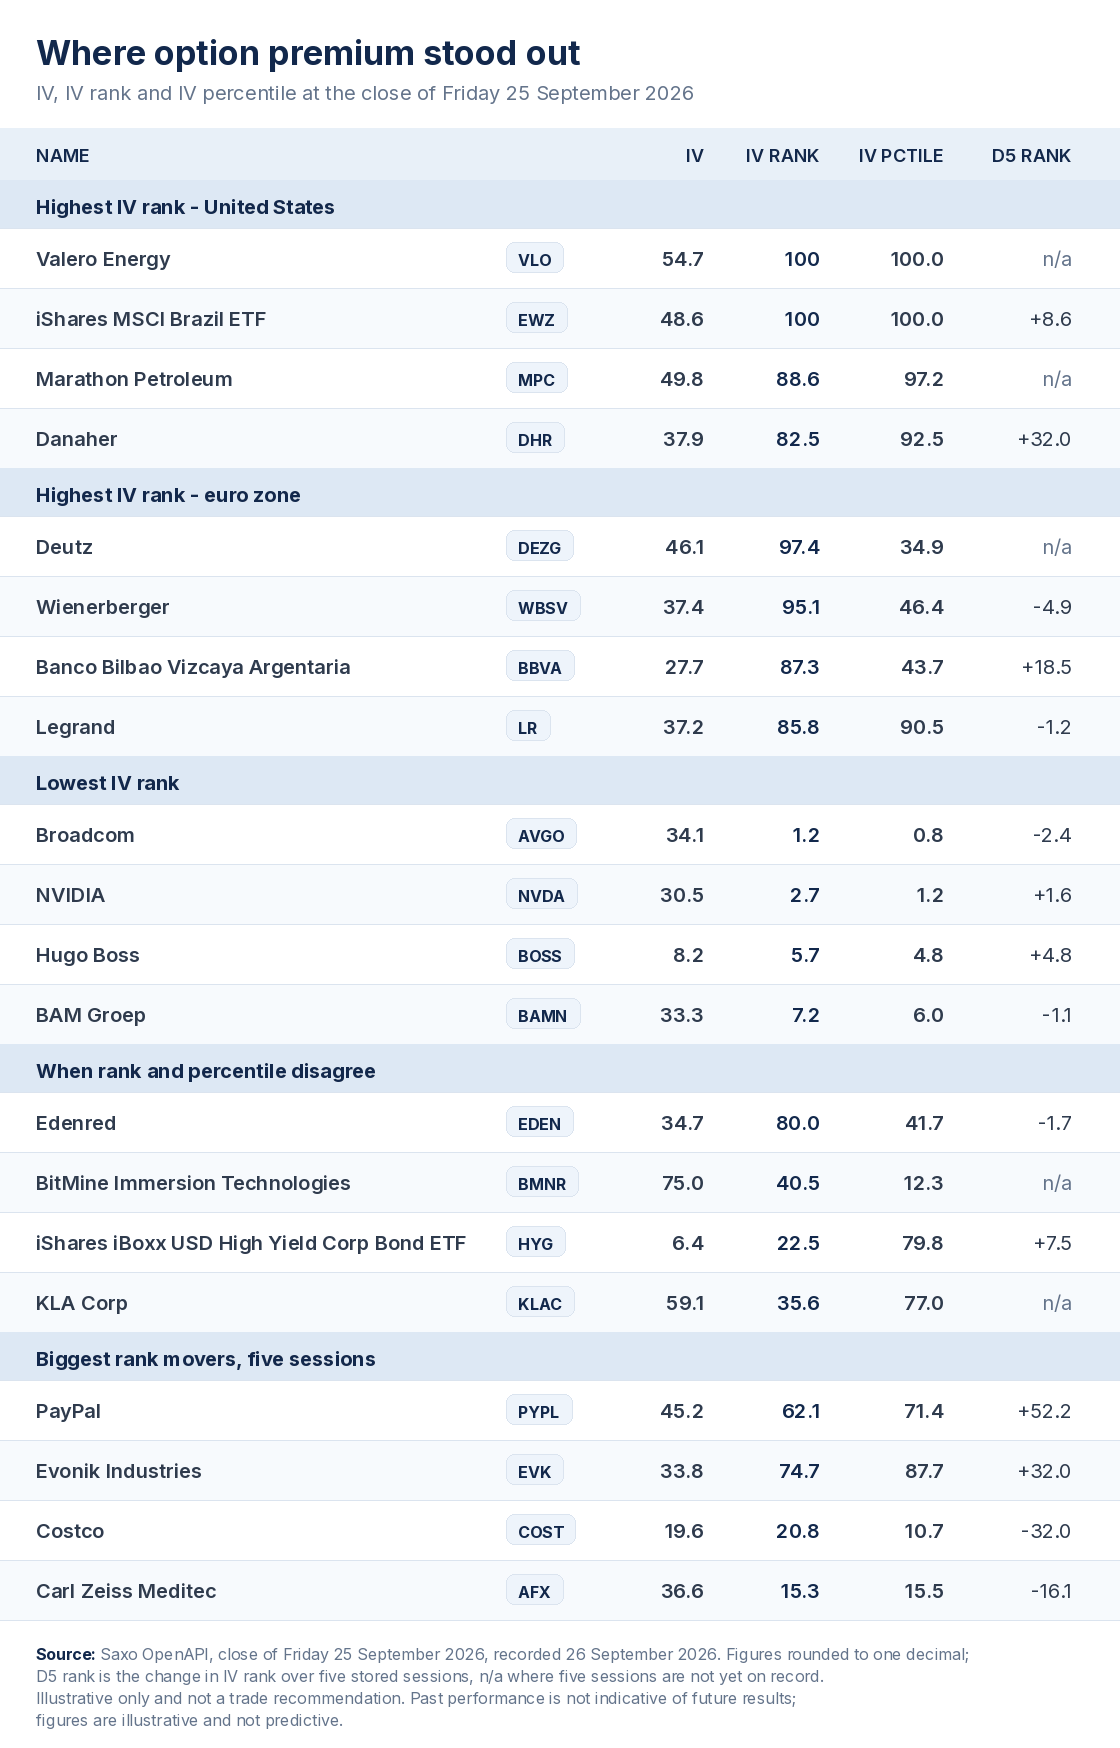 IV, IV rank and IV percentile for the twenty names, close of 25 September 2026. Source: Saxo OpenAPI
Past performance is not indicative of future results; figures are illustrative and not predictive.
Highest readings in the United States
- Valero Energy (VLO) - IV 54.7, rank 100, percentile 100. The year’s high, with no session closing above it.
- iShares MSCI Brazil ETF (EWZ) - IV 48.6, rank 100, percentile 100. See Saxo pricing for applicable costs and charges.
- Marathon Petroleum (MPC) - IV 49.8, rank 88.6, percentile 97.2. The second refiner here.
- Danaher (DHR) - IV 37.9, rank 82.5, percentile 92.5, with rank up about 32 points over five sessions.
Neither refiner reports inside the front expiry, Valero on 22 October 2026 and Marathon on 3 November 2026, which in our view may point to something priced in the energy complex rather than to company events. Danaher’s call is set for 21 October 2026, and health care carried the highest median US sector rank at 57.2. (Sources: company announcements, 8 September 2026; Danaher investor relations.) A long option bought at an elevated level can lose its whole premium even if the underlying moves as expected.
Highest readings in the euro zone
- Deutz (DEZG) - IV 46.1, rank 97.4, percentile 34.9. The widest gap between the two columns in Europe.
- Wienerberger (WBSV) - IV 37.4, rank 95.1, percentile 46.4. Above 94 two sessions earlier.
- Banco Bilbao Vizcaya Argentaria (BBVA) - IV 27.7, rank 87.3, percentile 43.7. Ten expiries.
- Legrand (LR) - IV 37.2, rank 85.8, percentile 90.5. The one name where both columns agree closely.
Three of these four show rank far above percentile, which appears to reflect a quiet European year interrupted by one sharp episode per name. All four carry at least eight listed expiries and share the 16 October 2026 front expiry, so the comparison is like for like. Deutz is a labelled exception: absent from the 24 September collection, it has two confirming sessions rather than three. A short option opened against an elevated reading carries risk not capped by the premium received.
Lowest readings
- Broadcom (AVGO) - IV 34.1, rank 1.2, percentile 0.8. Above 30 percent, yet at its own floor.
- NVIDIA (NVDA) - IV 30.5, rank 2.7, percentile 1.2. The same pattern on a familiar high-volatility name.
- Hugo Boss (BOSS) - IV 8.2, rank 5.7, percentile 4.8. Single-digit IV, eight-expiry book.
- BAM Groep (BAMN) - IV 33.3, rank 7.2, percentile 6.0. Eleven expiries.
Two European names with lower ranks were excluded rather than compared: Ion Beam Applications listed only three expiries, and Delivery Hero’s front expiry sat in December. Buying cheap optionality still costs premium that decays, and a low reading says nothing about when it will rise.
When rank and percentile disagree
- Edenred (EDEN) - IV 34.7, rank 80.0, percentile 41.7. Rank flattered by the range.
- BitMine Immersion Technologies (BMNR) - IV 75.0, rank 40.5, percentile 12.3. A high absolute level, a bottom-eighth percentile.
- iShares iBoxx USD High Yield Corporate Bond ETF (HYG) - IV 6.4, rank 22.5, percentile 79.8. The largest gap the other way. See Saxo pricing for applicable costs and charges.
- KLA Corp (KLAC) - IV 59.1, rank 35.6, percentile 77.0. Most of the year closed below this level.
HYG and KLAC would both be screened out by a rank filter set at 50, despite having spent most of the year cheaper than they were on Friday. Reading one column alone risks the wrong conclusion either way, and acting without checking the chain exposes a position to spreads the screen cannot see.
Biggest movers over five sessions
- PayPal (PYPL) - rank 62.1, up 52.2 points, IV 45.2, percentile 71.4. The largest rise in the scan.
- Evonik Industries (EVK) - rank 74.7, up 32.0 points, IV 33.8, percentile 87.7. The largest European rise.
- Costco (COST) - rank 20.8, down 32.0 points, IV 19.6, percentile 10.7. Results landed on 24 September 2026.
- Carl Zeiss Meditec (AFX) - rank 15.3, down 16.1 points, IV 36.6, percentile 15.5. The largest European fall.
Costco’s collapse is consistent with implied volatility falling once a scheduled event passed. PayPal’s rise is not: its call is set for 27 October 2026, outside the front expiry. (Sources: company announcement, 24 September 2026; PayPal investor relations.) Momentum in a rank is not momentum in a price, and a structure built on one can lose money even if the direction is right.
What the screen does not tell you
One session’s close, not a trend. Seventeen euro-zone underlyings returned no usable reading and two were flagged, so that sample is incomplete. Change figures rest on eight stored sessions, and nothing here accounts for spread, open interest or dividends.
Pulling the readings yourself
These figures come from Saxo’s OpenAPI, which returns implied volatility, rank and percentile for option underlyings, so traders can keep their own daily record. That route is covered in the webinar Using AI and OpenAPI to elevate your Saxo platform experience on 4 November 2026 at 13:00 CET.
Final thoughts
A screen like this separates two questions traders collapse into one: how much a market is moving, and how much movement is already priced. Broadcom at 34 percent and Hugo Boss at 8 percent both sat near their own floor, a fact about their options rather than their shares.
In our view the honest use of these columns is as a filter for which names deserve a look at the chain, where spread, open interest and the catalyst calendar do the real work. A high rank is not a sell signal, and the same holds in reverse at the cheap end.
Options carry a high risk of rapid loss and are not suitable for every investor. Future outcomes are uncertain and may result in losses. See Saxo pricing for costs and applicable charges: https://www.home.saxo/rates-and-conditions/pricing-overview
The author holds positions in the iShares MSCI Brazil ETF (EWZ), one of the instruments named in this article, and no position in any of the others mentioned. The Author is permitted to wait at least 24 hours from the time of the publication before they trade the instruments themselves.
| Related articles/content |
|---|
| Seventeen names where option premium stood out at September expiry | 21 Sep 2026 Finding unusually expensive or cheap options in the Saxo screener | 18 Sep 2026 Implied volatility rank what it measures and what it misses | 11 Sep 2026 Nine prints later what Q2 earnings season taught us | 11 Aug 2026 What IV crush really means in practice reviewed version | 9 April 2026 Trading earnings with defined | 31 Mar 2026 -- Bond vol overtakes equity vol - Options Brief - 25 September 2026 Yields spiked equity vol stayed cheap - Options Brief - 24 September 2026 |
| More from the author |
|---|